Partner contents:
The Arctic is still heating up faster than the global average
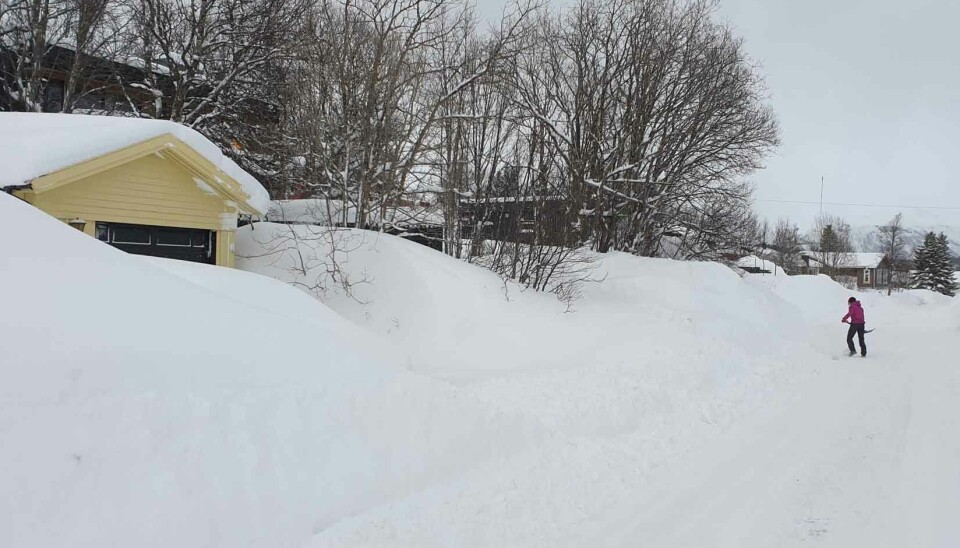
The fact that it’s freezing cold on your doorstep cannot be taken as proof that global warming has stopped. The Arctic is undergoing dramatic changes, but regional differences mean highly varied local and regional climate change impacts on people, vegetation, and wildlife.

By: Helge M Markusson // Dissemination Group Leader, Fram Centre
You may have heard comments from people who can’t understand what “those climate scientists” mean by global warming when the outdoor thermometer shows near-record-breaking low temperatures.
Here’s a report that may be useful and instructive.
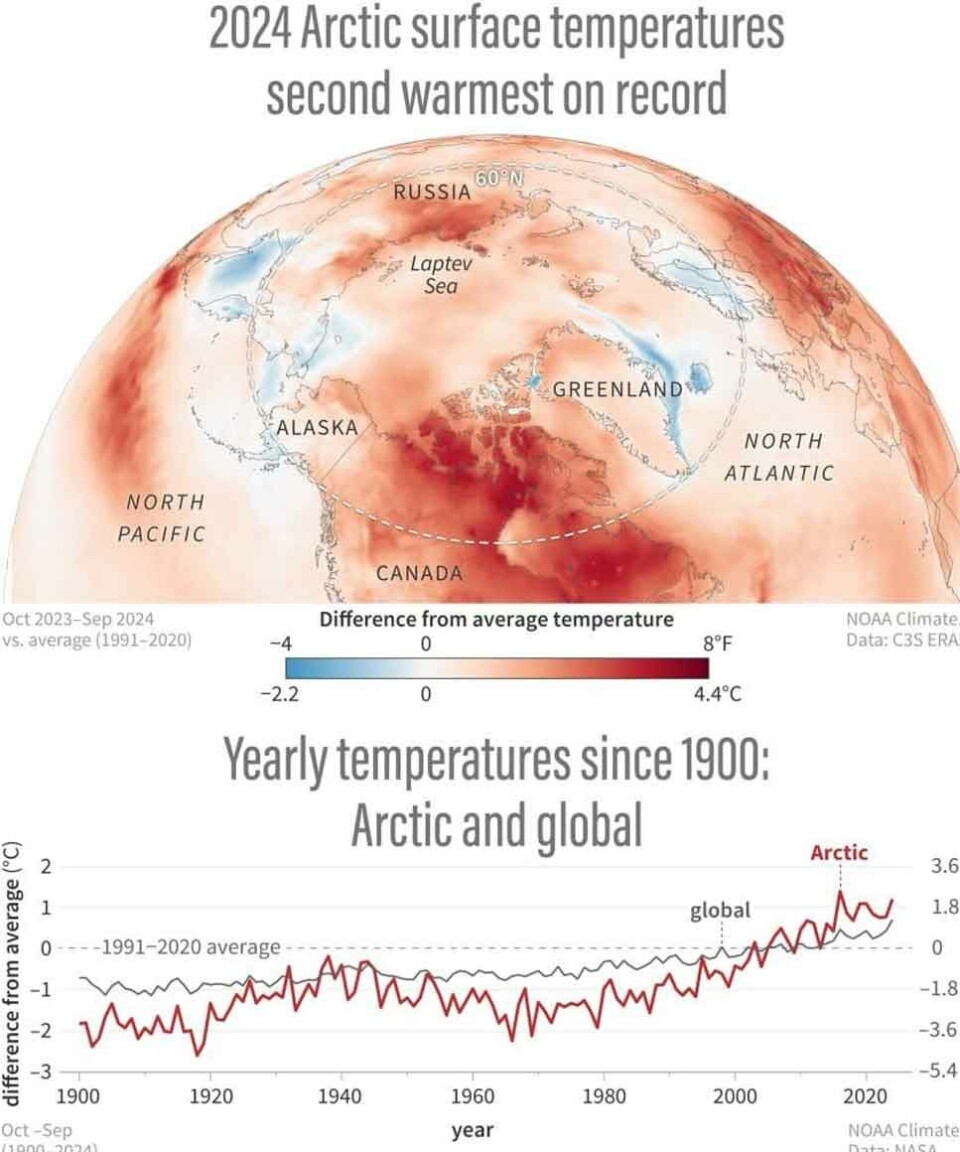
Whatever the climate-change sceptics may be asserting, the Arctic is still heating up faster than the global average. This is shown in the Arctic Report Card for 2024, compiled by 97 scientists and published by the National Oceanic and Atmospheric Administration in the United States.
The Arctic Report Card also states that the last decade has been the warmest decade in the Arctic, and that the past year was the second-warmest on since recording began in 1900.
“We also saw this at our Arctic stations, and especially the summer of 2024 was very warm. In August 2024, previous high temperature records were broken by several degrees Celsius at all the Arctic stations. And at Svalbard Airport, for the first time ever, the temperature recorded for August was over 20°C,” says Herdis Motrøen Gjelten, who supplies temperature data from the Norwegian Meteorological Institute’s stations in Svalbard and Jan Mayen.
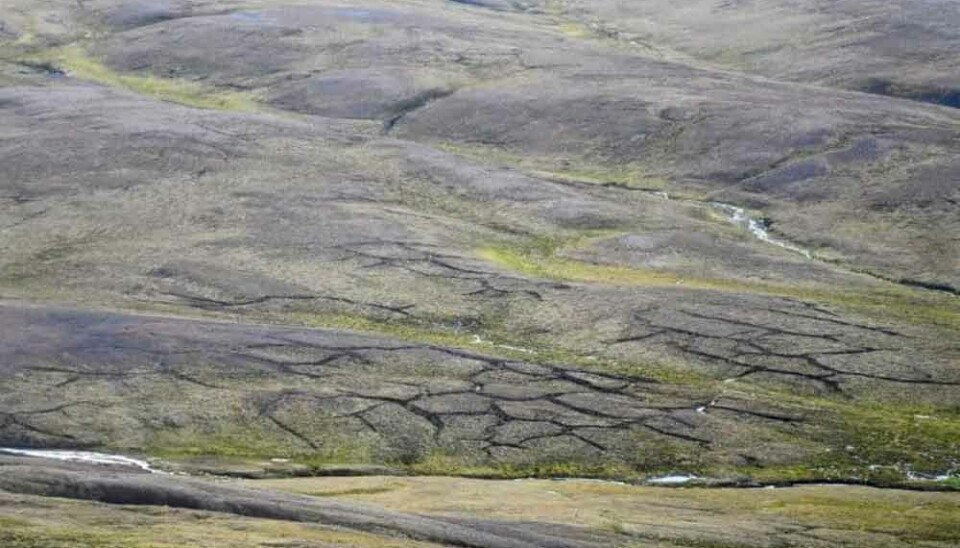
Changing tundra
The Report Card also describes transformation of the Arctic tundra, which is accelerated by multiple wildfires. Emissions from circumpolar forest fires have averaged 207 million tonnes of carbon per year since 2003. If we include the impact of increased forest fire activity, the Arctic tundra region has gone from being a carbon sink to being a carbon source, which means that as the tundra heats up, more CO2 will be emitted, causing further climate change.
The Report also describes a decline in what were once vast reindeer herds, particularly in North America, and increased winter precipitation. Regional differences make for highly varied local and regional climate change impacts on people, vegetation, and wildlife. Adaptation is increasingly essential. The report stresses that indigenous knowledge and community-led research programmes are crucial for understanding and responding to rapid Arctic changes.
Strong Norwegian contribution
Six scientists from Fram Centre member institutions contributed to ARC2024: Hans Tømmervik of the Norwegian Institute for Nature Research (NINA); Sebastian Gerland and Dmitry Divine from the Norwegian Polar Institute; Robert Ricker and Stein Rune Karlsen of NORCE research institute; and Herdis Motrøen Gjelten from the Norwegian Meteorological Institute.
“NINA has been working with these issues since 2016. Our measurement series from terrestrial instruments in Svalbard, deployed under the Svalbard Integrated Observation System (SIOS), are used for ground calibration of remote sensing data,” explains Hans Tømmervik, senior researcher at NINA, the Fram Centre.
Based on data from the entire circumpolar region, tundra greenness—a measure of productivity—was at its second-highest since 2000. The Norwegian Arctic includes Svalbard, Bjørnøya, Jan Mayen and coastal Finnmark. The eastern and coldest regions of Svalbard such as Edgeøya are showing the greatest increase in greenness since the start of the time series (MODIS satellite) in 2000.
“This is consistent with the retreat of glaciers and reduced sea ice in the Barents Sea. But the regions down to 60 degrees north that comprise most of Norway, Sweden and Finland have also shown increased greenness over the same period of time,” says Tømmervik.
Meanwhile, some areas in Sweden and Finnmark are showing reduced greenness due to forest damage caused by insects, birch moth outbreaks, and fungi. The greatest reduction in greenness is occurring in eastern Siberia, which is impacted by forest fires. Moreover, melting permafrost means more bodies of water. Fire and water together are responsible for the decline in productivity.
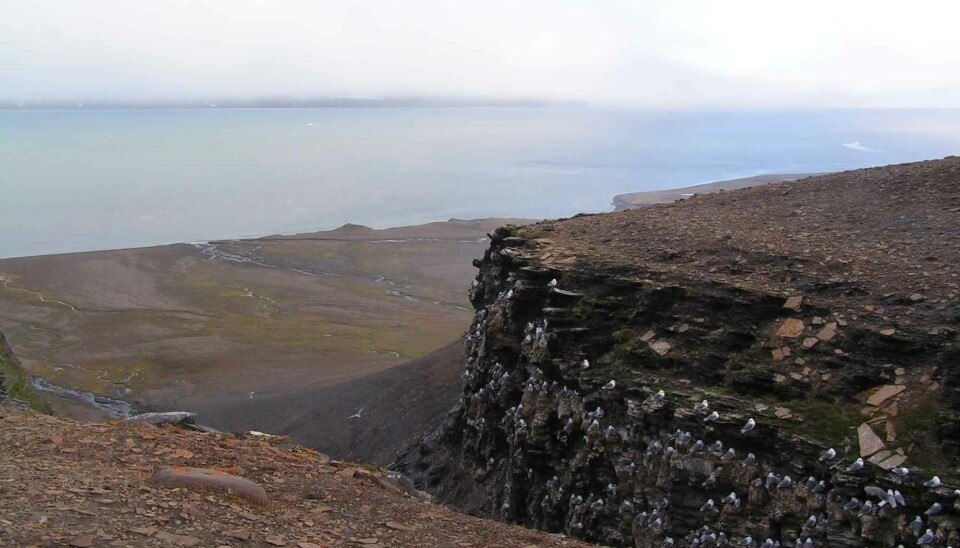
Less sea ice
Researchers from the Norwegian Polar Institute have contributed to the essays on sea ice in the Arctic since 2012. The latest sea ice essay states that the minimum extent of Arctic sea ice this year (September 2024) was the sixth-lowest in 45 years of continuous satellite observations. The 18 lowest sea ice year extents all occurred within the last 18 years.
“It’s exciting to have the opportunity to contribute to the Arctic Report Card and collaborate with international sea ice researchers. This work is an opportunity to put our long-term sea ice observations in the Fram Strait, the Barents Sea, the Arctic Ocean and Svalbard in a bigger context,” says Sebastian Gerland, Norwegian Polar Institute.
About the report
The Arctic Report Card, published annually since 2006, is a peer-reviewed source of environmental information on the current state of Arctic nature and environment, updated and compared to previous research series.
This year’s report contains 12 essays written by an international team of 97 researchers from 11 countries. An independent peer review of ARC2024 was organised by the Secretariat of the Arctic Monitoring and Assessment Programme (AMAP) located at the Fram Centre in Tromsø.
ARC is published by the National Oceanic and Atmospheric Administration (NOAA), a scientific agency of the US Department of Commerce. ARC is aimed at researchers, teachers, students, decision-makers, and the general public.
Read the Arctic Report Card for 2024.


